There are two ways to input KPI data into the infrastructure system.
Manually via the Manual Input Dashboard
Bulk uploading using the Bulk KPI Input Tool
You will find detailed instructions on how to upload KPI via these two methods in this guide.
TABLE OF CONTENTS
a. Creating the template and entering data
c. Staging Warnings & Data Differences
1. Manual Input Dashboard
a. Finding KPI data gap
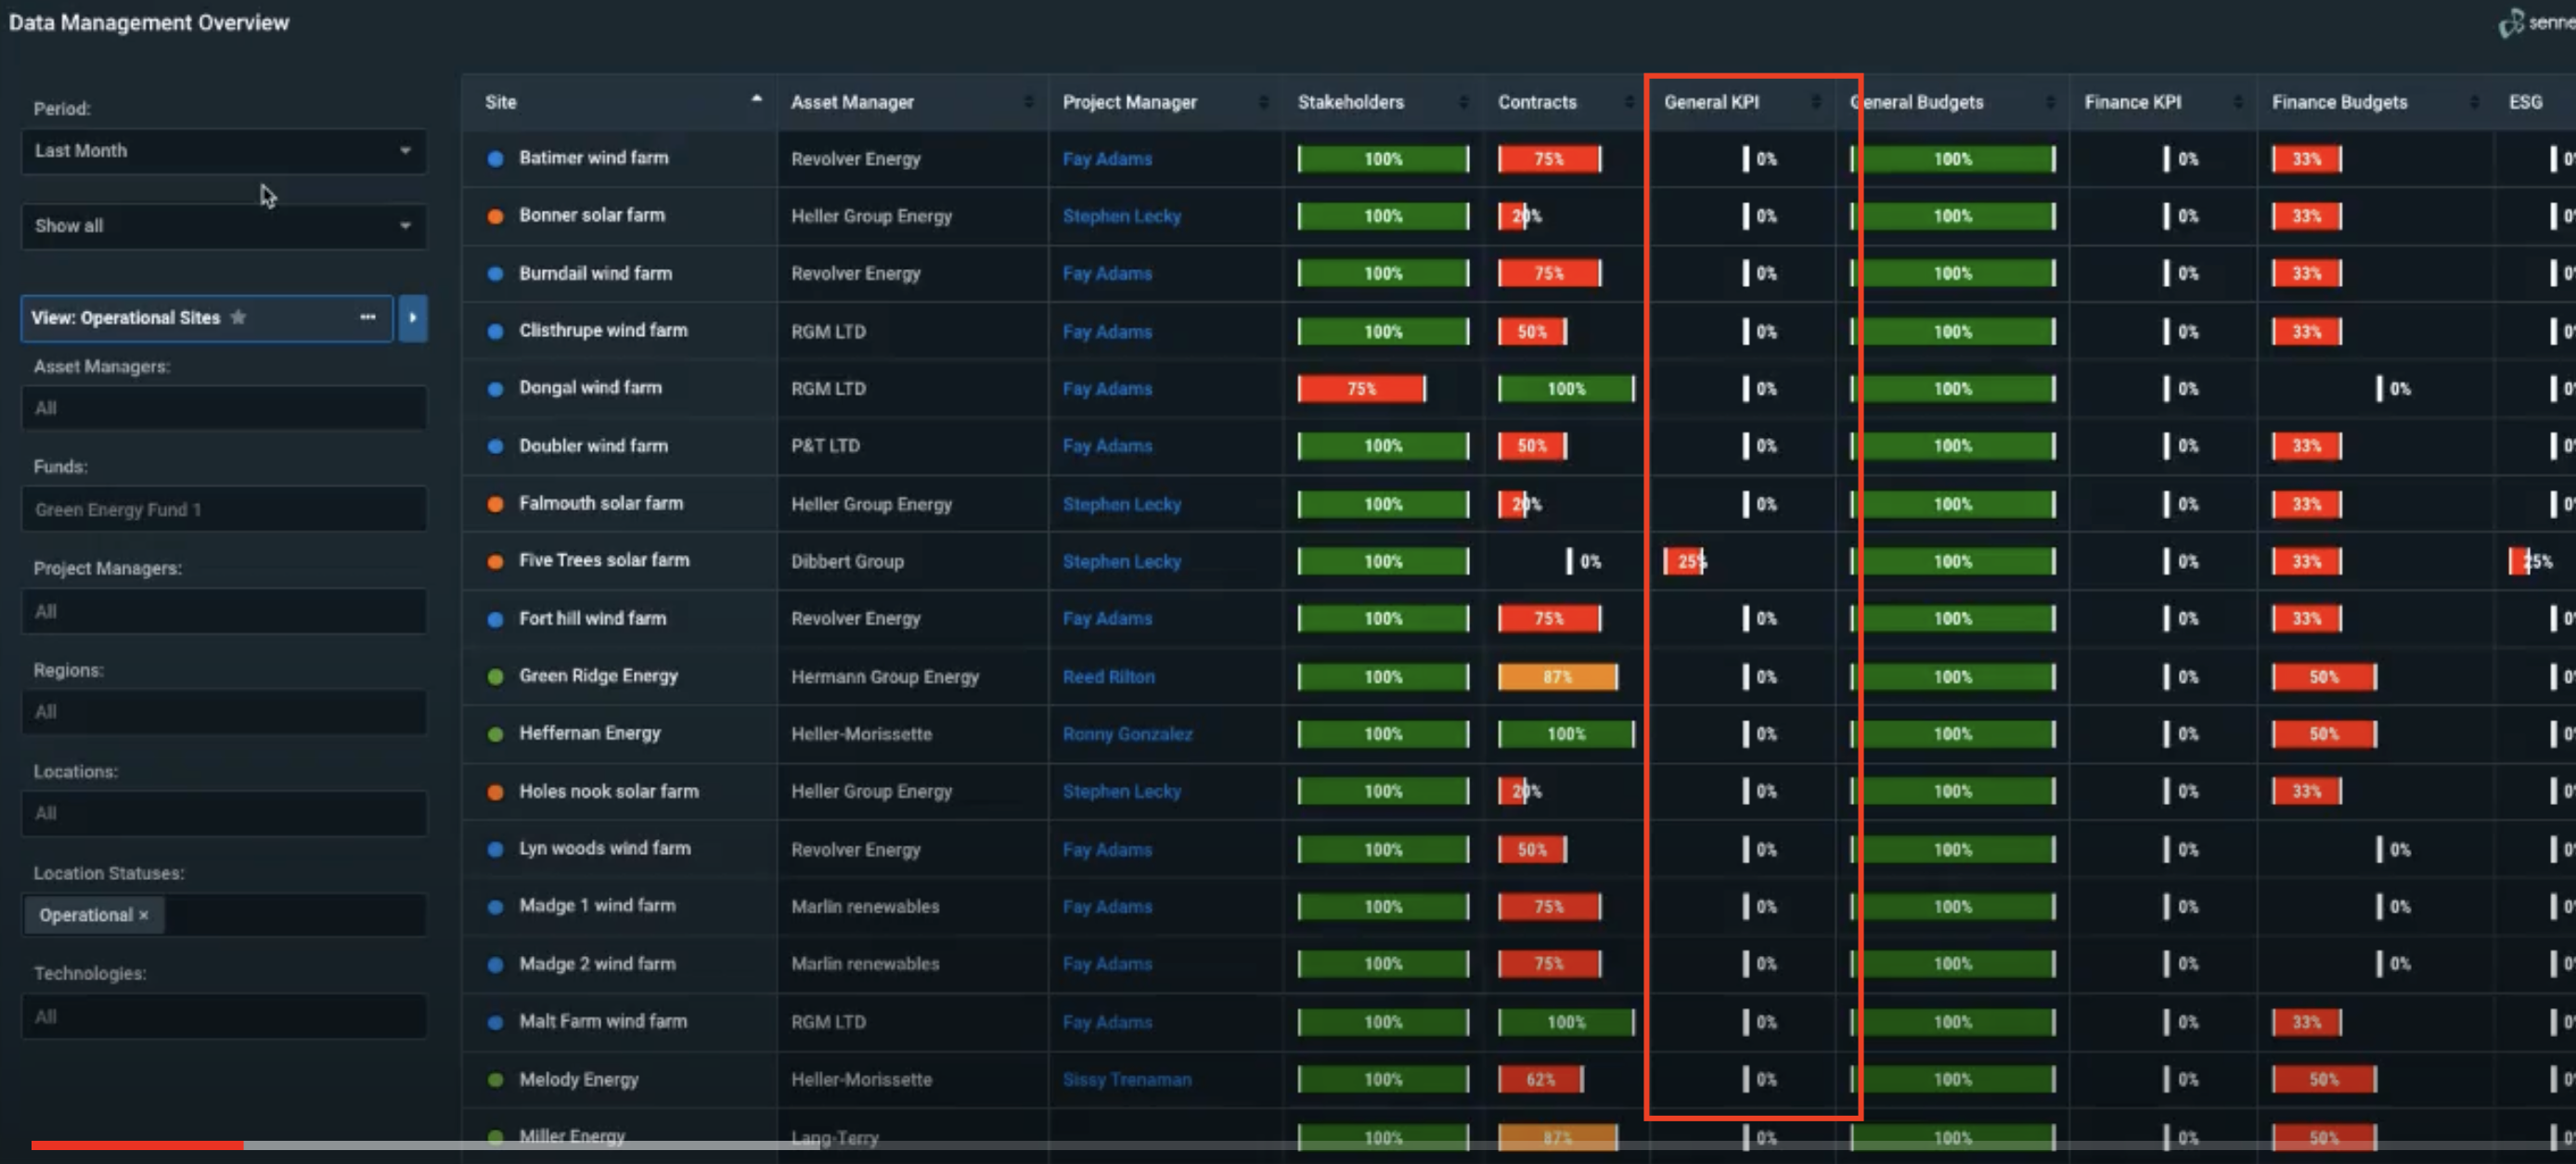
Firstly, go to Assets > Data Management - this will take you to the Data Management Overview screen where you can identify any KPI gaps and manually input data.
TIP: There is an option on the left side of the dashboard to filter the data by period, location, sites, etc.
You will find KPI data in the column ‘General KPI’ - a KPI completion rate will display in the cells for each asset ranging from 0-100% (0% = non-complete, 100% = completed).
By clicking on a General KPI cell, you will see two tabs: ESG and General KPI. The ‘ESG’ tab displays a breakdown of KPIs for an asset. The ‘General KPI’ tab displays uniform input.
Please note: the icon that shows an amber circle with a question mark indicates that the API field is a required value. The icon will turn green with a check mark when the field is complete. A field with no icon is optional and will not contribute to the complete calculations shown on the data management dashboard.

b. Manually entering data
To add KPI data, simply Click into a KPI field > Enter Value > Click Save OR if you would like to add 12 months of data at a time Click on the Calendar Icon > Enter Values > Click Save.
You will now be able to see the saved manual changes in the Data Management Screen.
2. Bulk KPI Input Tool
You may choose to bulk import KPI data rather than manually input. To do this, firstly, go to Assets > Bulk KPI Import - this is where you will bulk import your KPI data.
a. Creating the template and entering data
If you haven’t used the bulk KPI input tool before, I recommend downloading and using an example template - this will show you the required format for uploading KPI data.
To do this, go to ‘Please Select a template > Select Sennen Default > Download Template.

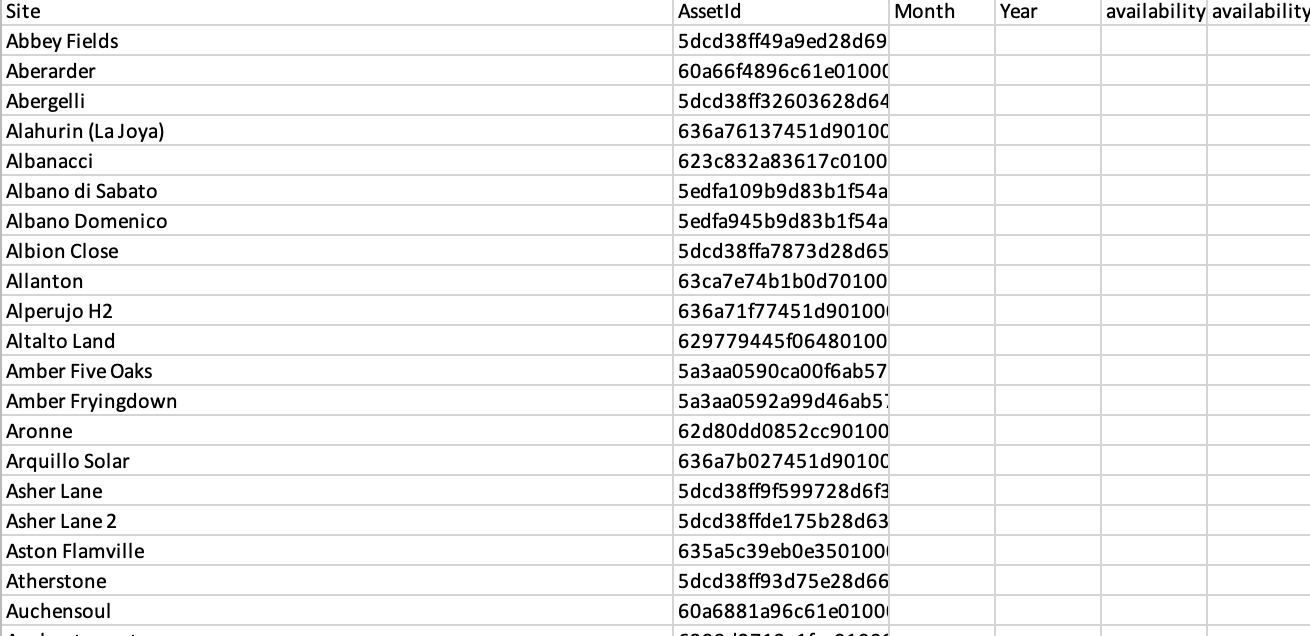
Once the template has been downloaded, you will be able to see prepopulated cells with all of the assets corresponding with their ID’s and a full list of KPIs used by your organisation. I recommend using this template to upload your data.
Tip: remove any assets, rows, and columns that are not relevant to you. But DO NOT alter any header names as they are essential to the upload.
When entering data into the sheet, please ensure the following things:
The data is entered using the correct unit
The sheet doesn’t include ANY formatting
There are no comma separators
Percentage values are added as percentages and not decimals (Eg. 98.7 NOT 0.978)
The sheet does not contain any formulas
Only enter 0 when the value is indeed 0 - leave the cell blank if there isn’t a value applicable
Save changes to your PC
b. Uploading the template
To upload your completed file, click ‘Upload File’ > Select saved file from PC >Click Open.
From here you will find a summary of the file you are uploading, including the number of rows, columns, sites, and the date range. If you are happy with the summary, click ‘Stage’ - this will show what changes will be made to the data upon import.
c. Staging Warnings & Data Differences
Warnings - you may find that there are warnings in the Staged Data summary (an amber question mark icon) - hover over the cell to read the warning.
To remove the warning, you can either correct the data in the upload template (if it is incorrect) > Refresh Page > Reupload OR if the data is accurate you can Click on the cell to acknowledge that the cell is correct.
Data Differences - A blue arrow icon may appear to show how the data that has been uploaded differs to the data already in the system. 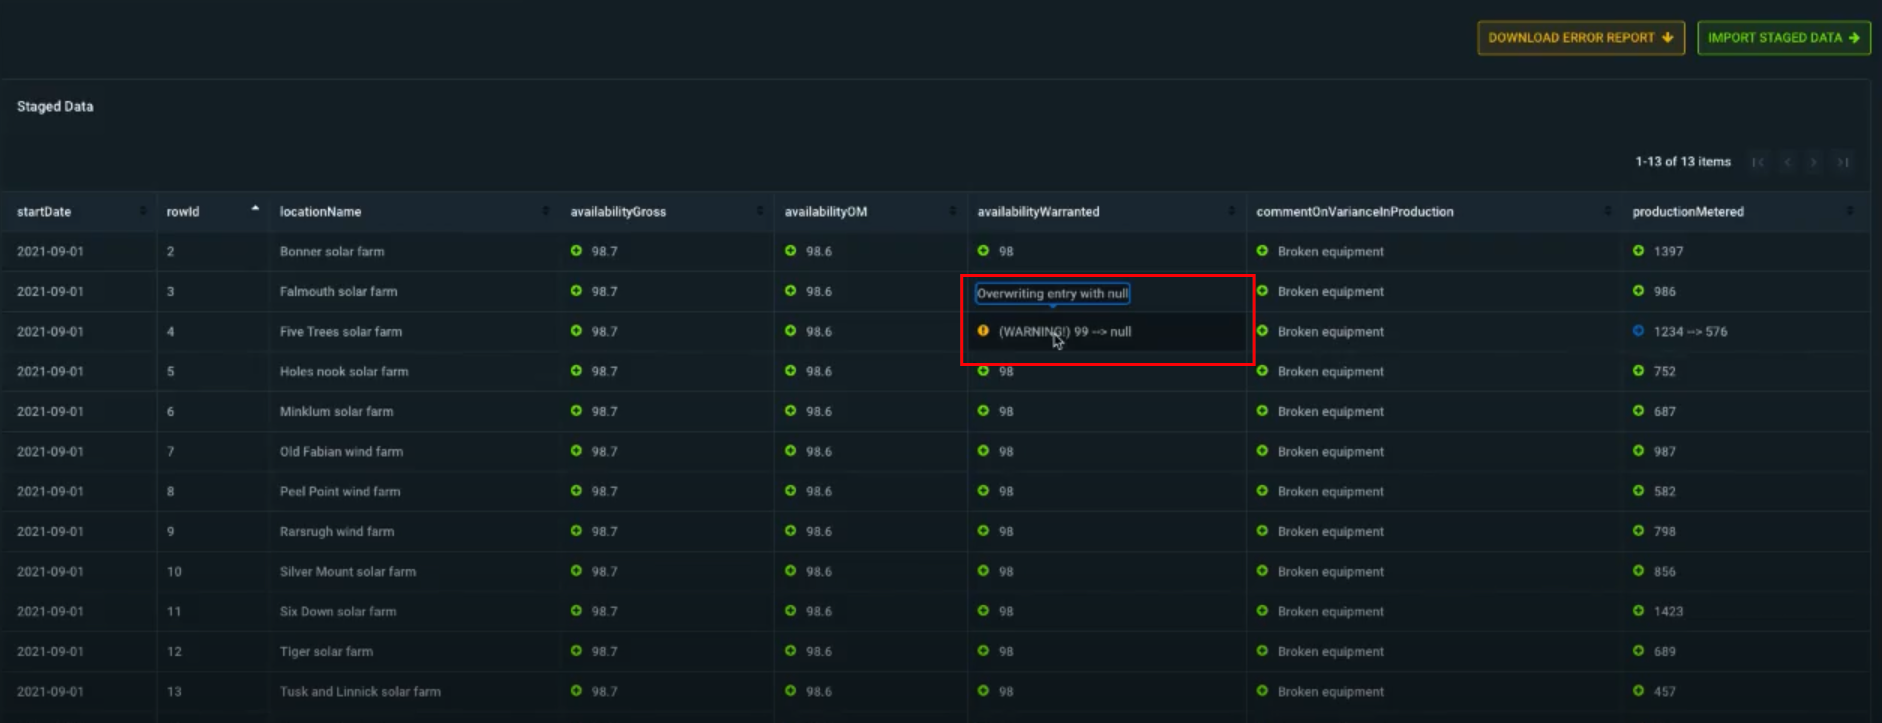
When satisfied with the data, you will need to import the staged data into the system. To do this, click on Import Staged Data > Click ‘Ok’ in the overwrite existing data acknowledgement pop up.
You will now be able to see the changes from the upload in the Data Management Screen.
If you have any further questions or require assistance on this topic, please contact our support team by raising a Freshdesk ticket and referencing this article.
Was this article helpful?
That’s Great!
Thank you for your feedback
Sorry! We couldn't be helpful
Thank you for your feedback
Feedback sent
We appreciate your effort and will try to fix the article